Understanding TradingView: A Comprehensive Introduction
In today's fast-paced financial markets, traders require robust tools to analyze price movements, track trends, and execute trades effectively. TradingView stands out as one of the leading platforms, offering an extensive suite of features that caters to both novice and experienced traders alike. This article delves into the intricacies of TradingView, exploring its key functionalities, how to set up your trading environment, advanced charting techniques, backtesting strategies, and engaging with its vibrant community.
What is TradingView?
Launched in 2011, TradingView has quickly transformed into a social network for traders and investors, combining sophisticated charting capabilities with collaborative features. It allows users to create custom indicators, share trading ideas, and engage in discussions with a global community. What sets TradingView apart is its accessibility; users can access the platform via web browsers, desktop applications on Windows and macOS, as well as mobile apps for iOS and Android, making it a versatile tool for traders on the go.
Key Features of TradingView
- Multi-Asset Support: TradingView covers a wide range of asset classes, including stocks, forex, cryptocurrencies, commodities, and more, allowing traders to diversify their portfolios and explore multiple markets without switching platforms.
- Advanced Charting Tools: With a plethora of chart types, technical indicators, and drawing tools, TradingView enables traders to perform in-depth technical analysis and visualize market trends effectively.
- Custom Alerts: Users can set price alerts, indicator alerts, and even alerts based on custom criteria using Pine Script, ensuring they stay updated on market movements and can act swiftly.
- Social Integration: The platform features a community-driven approach where traders can share ideas, scripts, and analysis, fostering collaboration and learning among users.
- Strategy Tester: Traders can backtest their strategies against historical data to assess their performance and make data-driven decisions.
Setting Up Your Trading Environment
Customizing Your TradingView Workspace
Setting up a personalized workspace on TradingView is essential for productivity and efficiency. Users can arrange charts, watchlists, and news feeds according to their trading styles. Here’s how you can optimize your workspace:
- Choose the Right Layout: TradingView offers various layouts that allow you to view multiple charts simultaneously, which is particularly useful for day traders who monitor several asset classes.
- Save Templates: By saving chart templates with preferred indicators and settings, you can streamline your analysis process, reducing the time spent on setup for each trading session.
- Utilize Dark Mode: For late-night trading or long hours in front of the screen, enabling dark mode can reduce eye strain and enhance visibility.
Integrating Multiple Markets on TradingView
With TradingView, switching between different markets is seamless. Users can input asset tickers directly into the search bar to access charts and data for various securities globally. This multi-market integration allows traders to:
- Diversify Investing: Easily track market movements across different sectors without having to log into multiple brokerage accounts.
- Analyze Global Economic Indicators: Keep an eye on fundamental data releases from various regions, helping to gauge potential market impacts.
Utilizing Trading View’s Alert System Effectively
TradingView's alert system is a powerful feature that enables traders to receive notifications based on specific market conditions. To make the most of this feature, consider the following:
- Set Specific Conditions: Instead of generic alerts, customize them based on price levels, technical indicators, or even patterns to ensure they are relevant.
- Use Multiple Notification Methods: Choose to receive alerts via email, SMS, or mobile app notifications for immediate updates.
Advanced Charting Techniques with TradingView
Understanding Candlestick Patterns
Candlestick patterns are critical for predicting price movements. TradingView provides extensive tools to analyze these patterns effectively. Familiarize yourself with common patterns such as:
- Doji: Indicates indecision in the market.
- Engulfing Patterns: Can signal reversals when a larger candle completely engulfs the previous one.
- Hammer and Hanging Man: Key indicators of potential reversals at market tops or bottoms.
Using Technical Indicators for Better Decisions
Technical indicators are essential for making informed trading decisions. TradingView supports a wide range of indicators, including:
- Moving Averages (MA): Useful for identifying trends and potential reversal points.
- Relative Strength Index (RSI): Helps identify overbought or oversold conditions in the market.
- Bollinger Bands: Indicates volatility and potential price targets based on standard deviation.
Creating and Saving Custom Chart Layouts
Custom chart layouts enhance your analytical capabilities by allowing you to tailor your view to suit particular trading strategies. Here’s how to create and save layouts:
- Save Chart Layouts: After customizing a chart with your preferred indicators and settings, save it for future use to streamline your workflow.
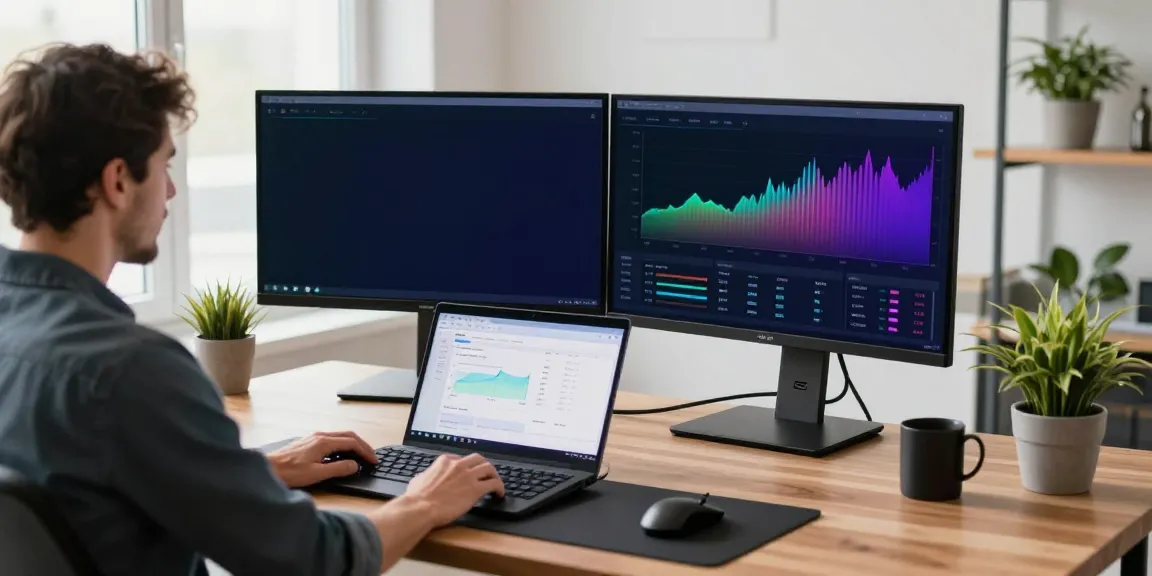
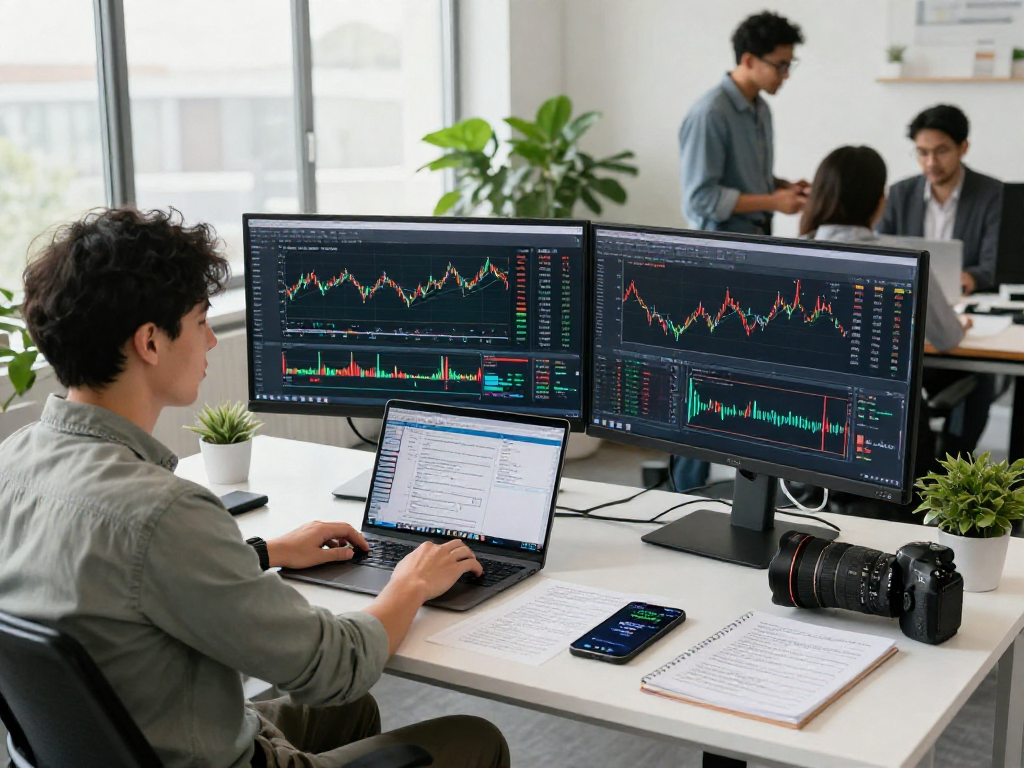
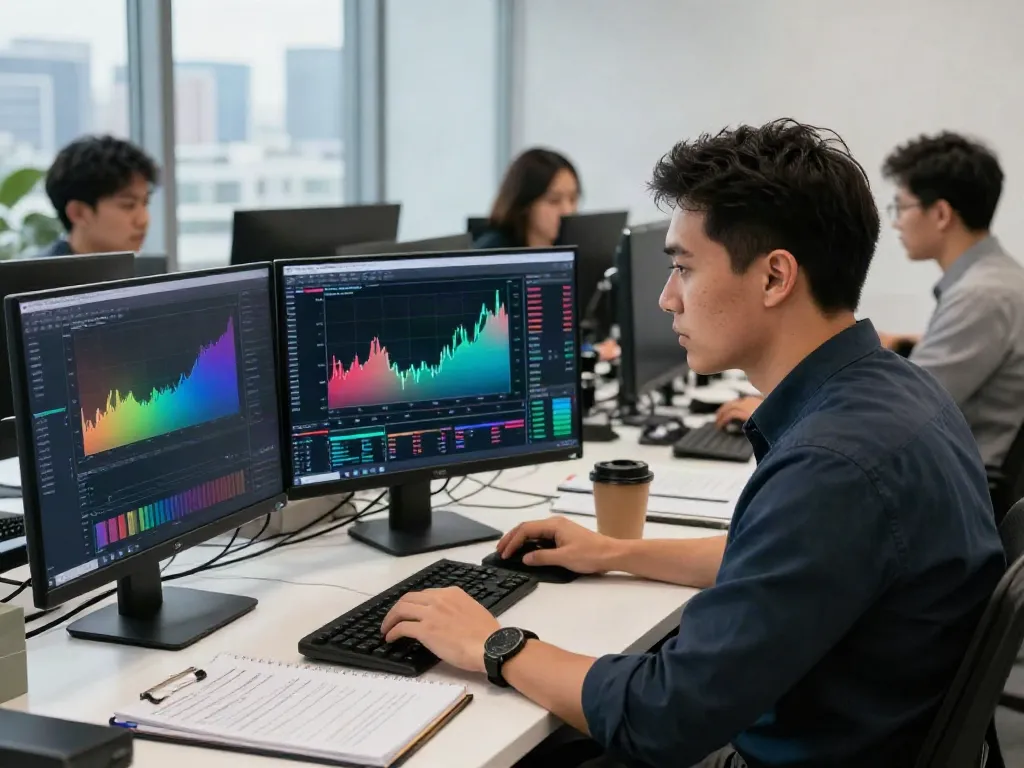
- Use Multiple Monitors: For serious traders, using multiple monitors can significantly enhance productivity by displaying different charts and indicators simultaneously.
Backtesting Strategies with TradingView
How to Use the Strategy Tester
The Strategy Tester is one of TradingView's most powerful features, allowing traders to evaluate their trading strategies against historical data. To effectively use the Strategy Tester:
- Define Your Strategy: Write down the rules for your trading strategy, including entry and exit points, risk management techniques, and position sizing.
- Run Backtests: Execute your strategy against historical data to see how it would have performed under various market conditions.
Analyzing Historical Data for Future Trades
Analyzing historical performance is vital for refining your trading approach. Use TradingView's extensive data sets to evaluate how different strategies fare in market conditions:
- Review Performance Metrics: Assess metrics such as win rate, maximum drawdown, and risk-to-reward ratios to understand your strategy's effectiveness.
- Adjust and Optimize: Based on your findings from backtesting, make necessary adjustments to your strategy for improved performance.
Common Mistakes to Avoid in Backtesting
While backtesting can provide valuable insights, traders must avoid several common pitfalls:
- Overfitting: Adjusting a strategy too much to fit historical data can lead to poor future performance.
- Ignoring Market Conditions: Historical data is not always indicative of future performance, especially in changing market conditions.
Community Insights and Trading Scripts
Exploring Pine Script for Custom Indicators
Pine Script is TradingView's proprietary scripting language that allows users to create custom indicators and strategies. This feature opens up a world of possibilities for traders looking to personalize their analysis:
- Create Unique Indicators: Develop indicators tailored to your trading strategy and share them with the TradingView community or use them privately.
- Analyze Community Scripts: Leverage scripts developed by other users to enhance your trading toolkit and learn new strategies.
Engaging with the TradingView Community
The TradingView community is a rich resource for traders seeking new ideas and strategies. Engaging with others can provide insights that you may not have considered:
- Join Discussions: Participate in forums and discussions to share insights and learn from other traders’ experiences.
- Follow Influencers: Identify and follow experienced traders whose strategies resonate with you for ongoing learning.
Best Practices for Sharing Your Strategies
When sharing your strategies on TradingView, it's important to follow best practices to ensure clarity and effectiveness:
- Provide Context: Explain the reasoning behind your strategies so others can understand your approach and learn from it.
- Be Open to Feedback: Engage with comments and suggestions from other traders; this can lead to improvements in your strategies.
Is TradingView Actually Free?
While TradingView offers a free version with limited features, many advanced functionalities require a paid subscription. The free version is sufficient for beginner traders or those who do not require extensive tools. For serious traders who need additional features, such as enhanced charting tools and more alerts, a subscription can prove invaluable.
Can You Trust TradingView?
Yes, TradingView is a reputable platform that is widely used by traders and investors globally. It offers a secure environment for trading and conducting research, backed by a strong community and consistent updates to maintain the platform's integrity and functionality.
What Features Set TradingView Apart from Competitors?
TradingView distinguishes itself from competitors through its user-friendly interface, extensive customization options, and robust community engagement. The combination of sophisticated charting tools, the ability to create custom scripts, and the support for multi-asset trading sets it apart in the online trading landscape.
How to Make the Most of TradingView Alerts?
To maximize the effectiveness of TradingView alerts, remain specific with your criteria, ensure you are using multiple alert types, and regularly review your alert settings to adapt to changing market conditions. This proactive approach will help you stay ahead in the fast-moving trading environment.
What are the Best Practices for Trading on TradingView?
Best practices for trading on TradingView include utilizing its extensive charting tools, leveraging alerts effectively, engaging with the community for insights, and continuously educating yourself on new strategies and market trends. By implementing these practices, traders can improve their performance and optimize their trading experience.